import matplotlib.pyplot as plt
import numpy as np27 Matplotlib
The very basics of matplotlib
The first example from the ([docs])
x = np.linspace(0, 2 * np.pi, 200)
y = np.sin(x)

fig, ax = plt.subplots()
ax.plot(x, y)
plt.show()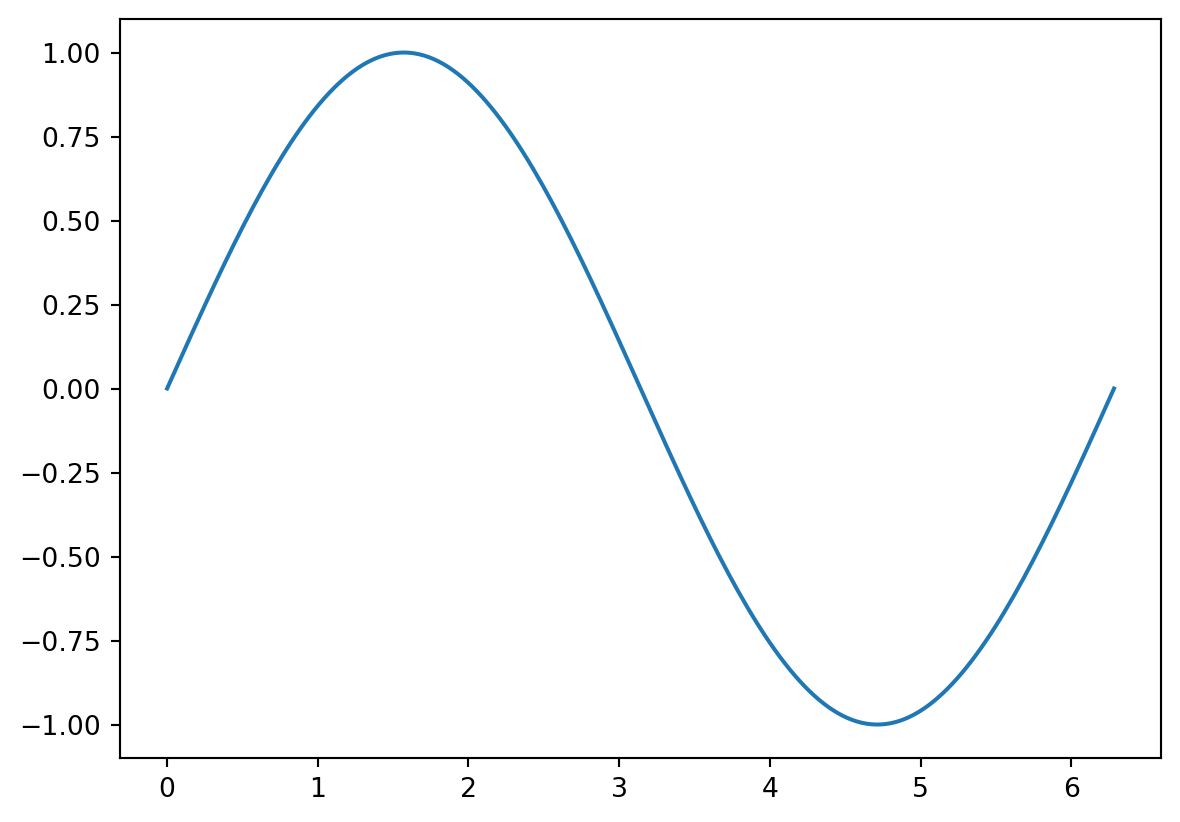
27.1 Boxplot
x = np.random.randn(300)
y = np.random.randn(400) + 1.6
z = np.random.randn(320) - 2.2plt.boxplot(x);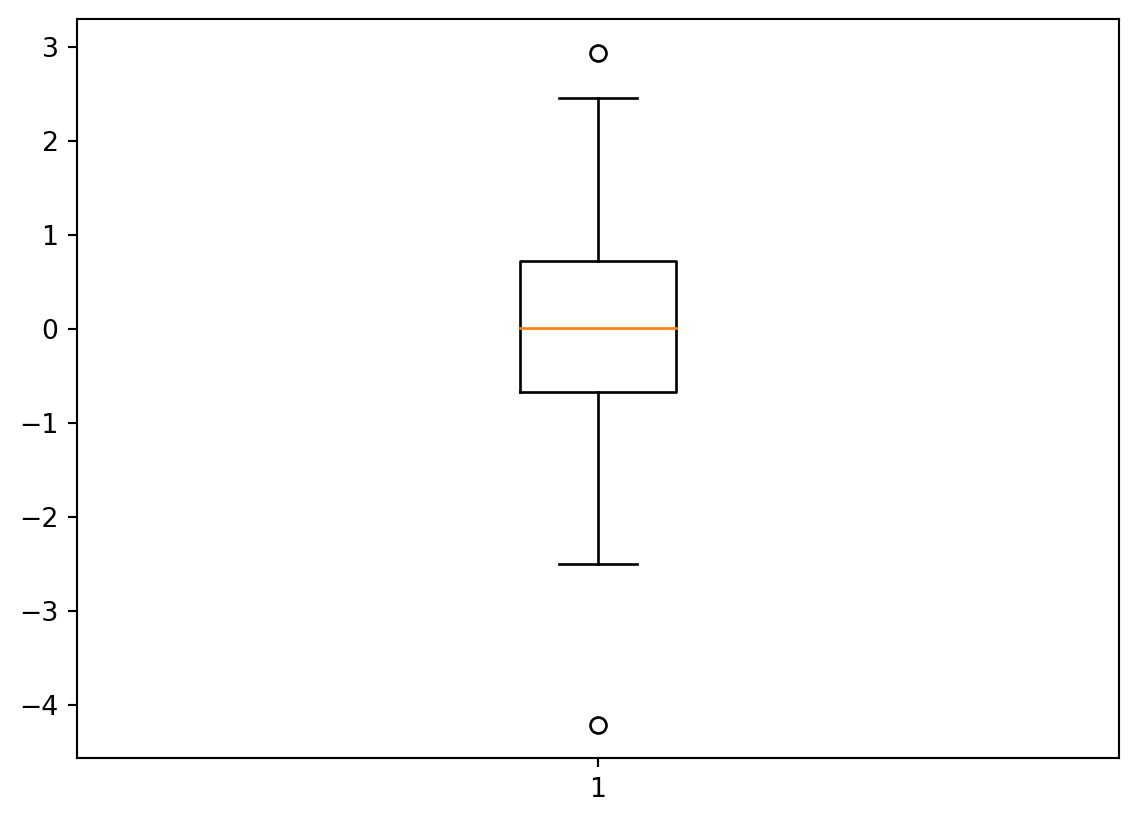
plt.boxplot([x, y, z]);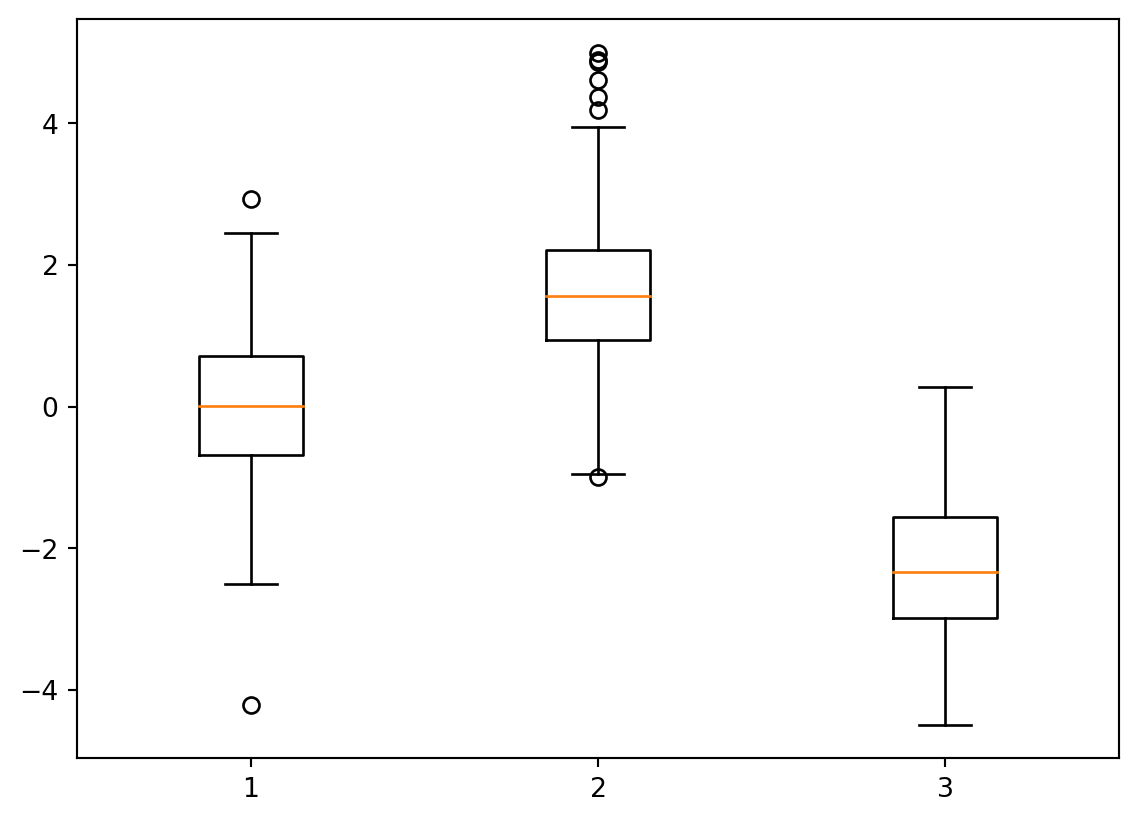
27.2 Histogram
plt.hist(x, bins=32)(array([ 1., 0., 0., 0., 0., 0., 0., 2., 0., 2., 6., 7., 12.,
13., 12., 26., 21., 21., 31., 21., 25., 22., 19., 16., 19., 10.,
1., 6., 3., 3., 0., 1.]),
array([-4.20942858, -3.98611008, -3.76279158, -3.53947308, -3.31615458,
-3.09283608, -2.86951758, -2.64619907, -2.42288057, -2.19956207,
-1.97624357, -1.75292507, -1.52960657, -1.30628807, -1.08296957,
-0.85965106, -0.63633256, -0.41301406, -0.18969556, 0.03362294,
0.25694144, 0.48025994, 0.70357845, 0.92689695, 1.15021545,
1.37353395, 1.59685245, 1.82017095, 2.04348945, 2.26680795,
2.49012646, 2.71344496, 2.93676346]),
<BarContainer object of 32 artists>)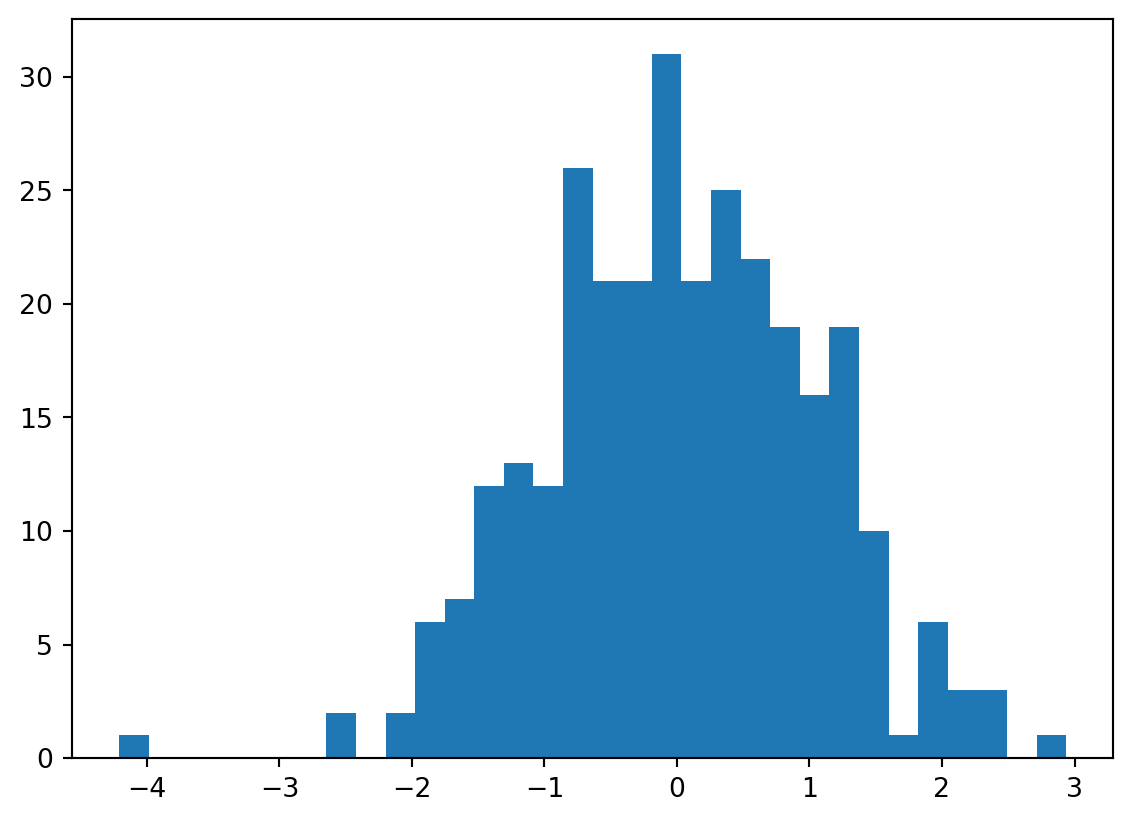
plt.hist([x, y, z])(array([[ 1., 0., 14., 57., 103., 86., 33., 6., 0., 0.],
[ 0., 0., 0., 5., 34., 107., 144., 82., 22., 6.],
[ 37., 82., 114., 68., 17., 2., 0., 0., 0., 0.]]),
array([-4.48502608, -3.5363811 , -2.58773611, -1.63909113, -0.69044614,
0.25819884, 1.20684383, 2.15548882, 3.1041338 , 4.05277879,
5.00142377]),
<a list of 3 BarContainer objects>)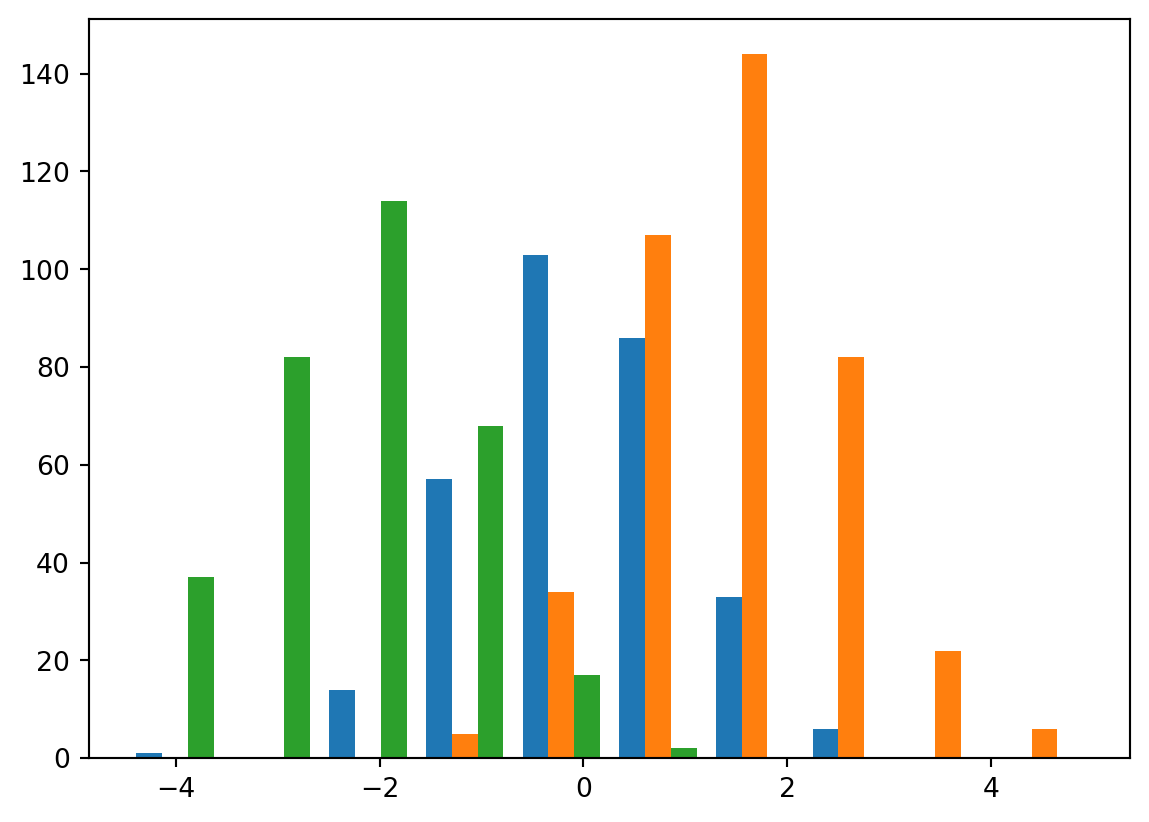
27.3 Scatter
x = np.random.randn(300);
y = 3 + x**3 + np.random.randn(300);
y2 = 4 + x**2 + np.random.randn(300);
plt.scatter(x, y)<matplotlib.collections.PathCollection at 0x155bb7340>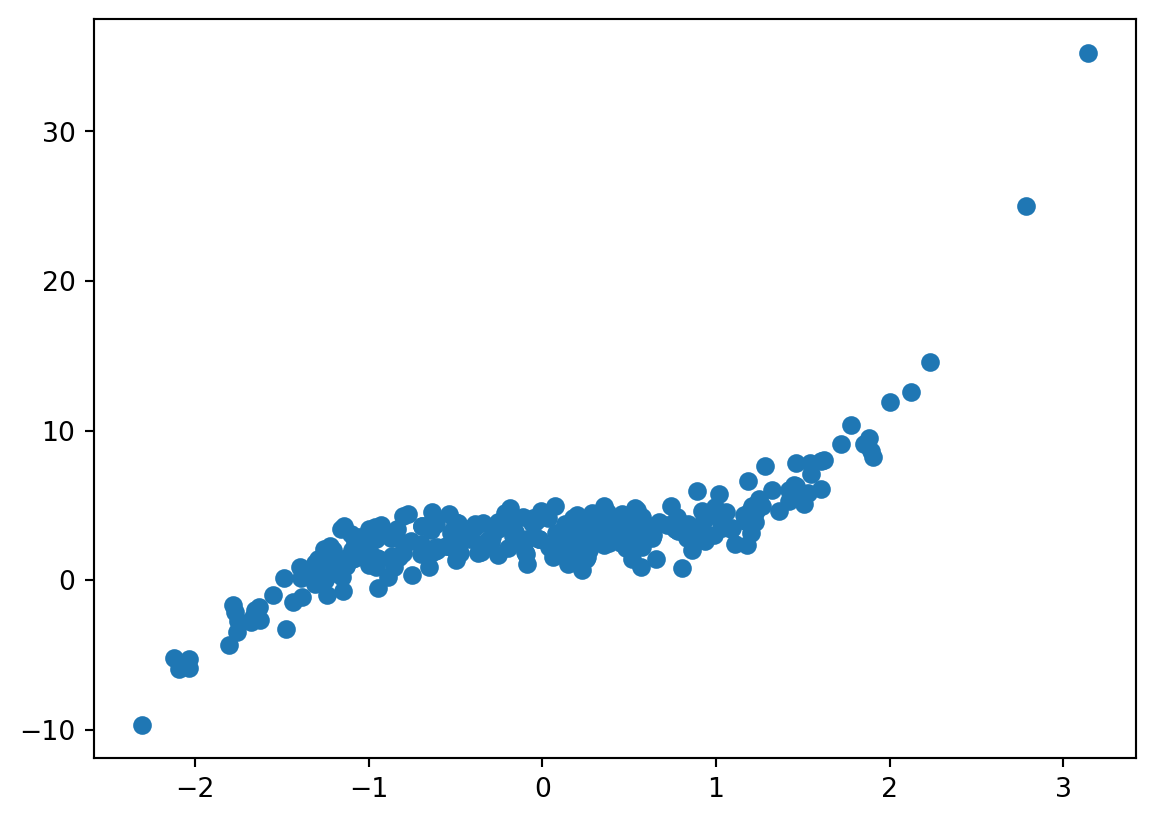
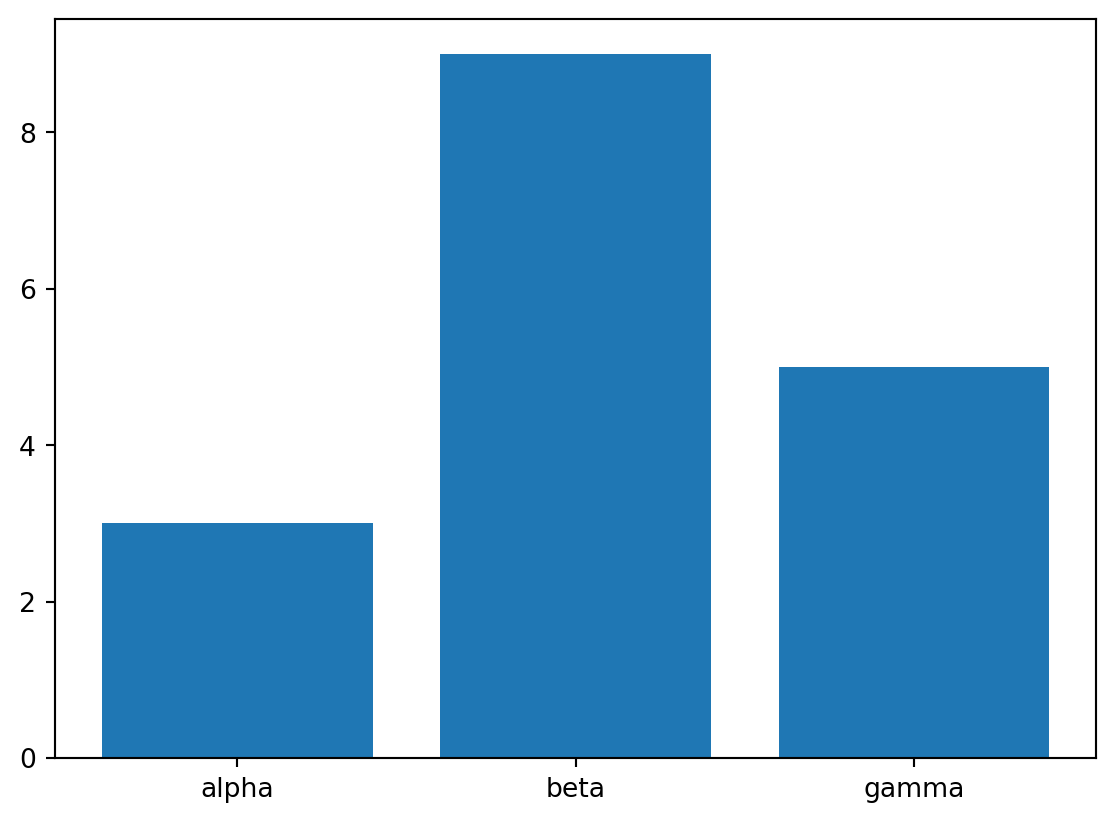
27.4 Barplot
x = np.array(["alpha", "beta", "gamma"])
y = np.array([3, 9, 5])
y2 = np.array([5, 8, 7])
plt.bar(x, y);