2 Data
The Data module allows you to:
- Upload data onto the platform
- View your data as a spreadsheet
- sort by any column
- search
- Filter
- Download filtered data
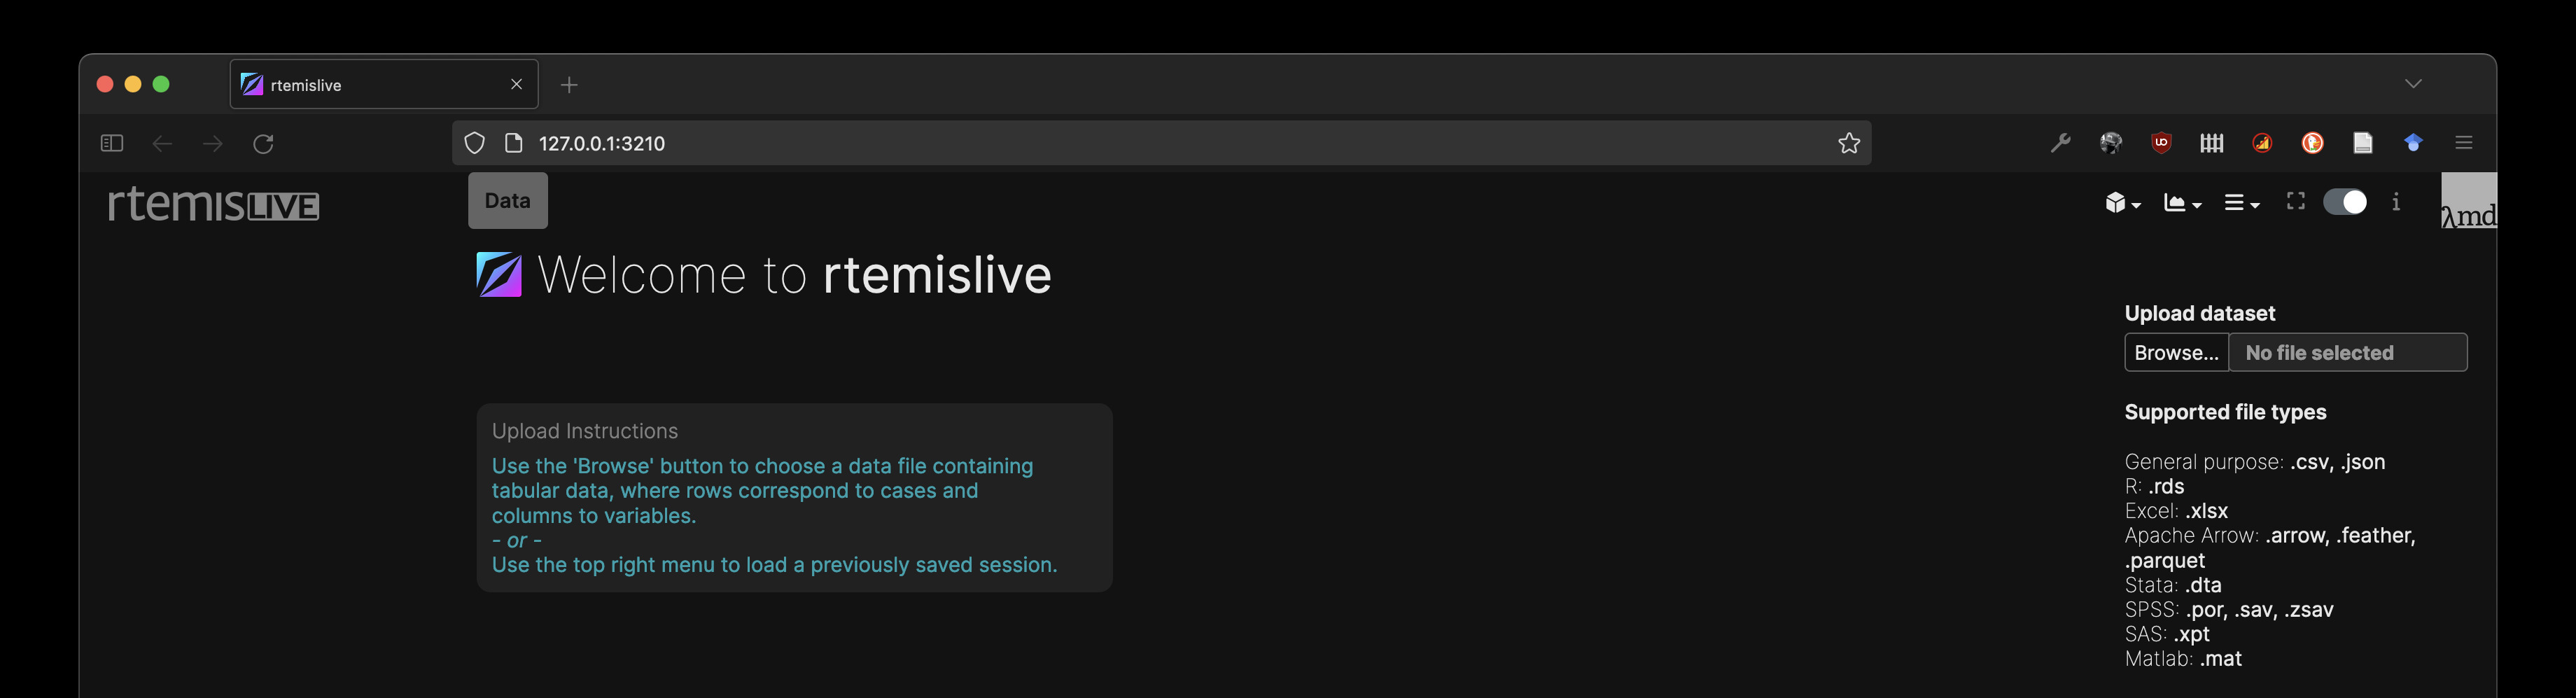
2.1 Uploading data
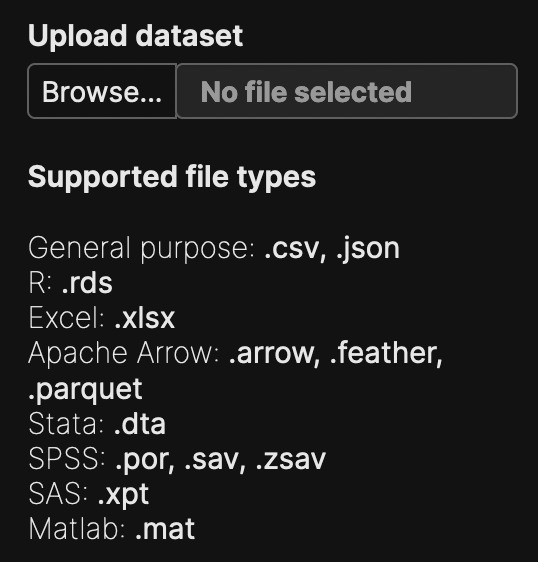
rtemislive supports a wide range of file types, including some of the most popular tabular data formats:
- General purpose: .csv, .json
- R: .rds
- Excel: .xlsx
- Apache Arrow: .arrow, .feather, .parquet
- Stata: .dta
- SPSS: .por, .sav, .zsav
- SAS: .xpt
- Matlab: .mat
It is best to upload clean data, when possible.
Clean data includes:
- Descriptive column names that always begin with letters (not numbers!) and contain no symbols other than underscores
- Descriptive categorical levels: e.g. “Female”, “Male”, not “1”, “2”; “Control”, “Case”, not “0”, “1”)
- Missing values indicated by “NA”
If you have prepared a dataset in R, the most convenient way to upload to rtemislive is to use saveRD() in R to save to an RDS and then upload that file. This will maintain all column classes.
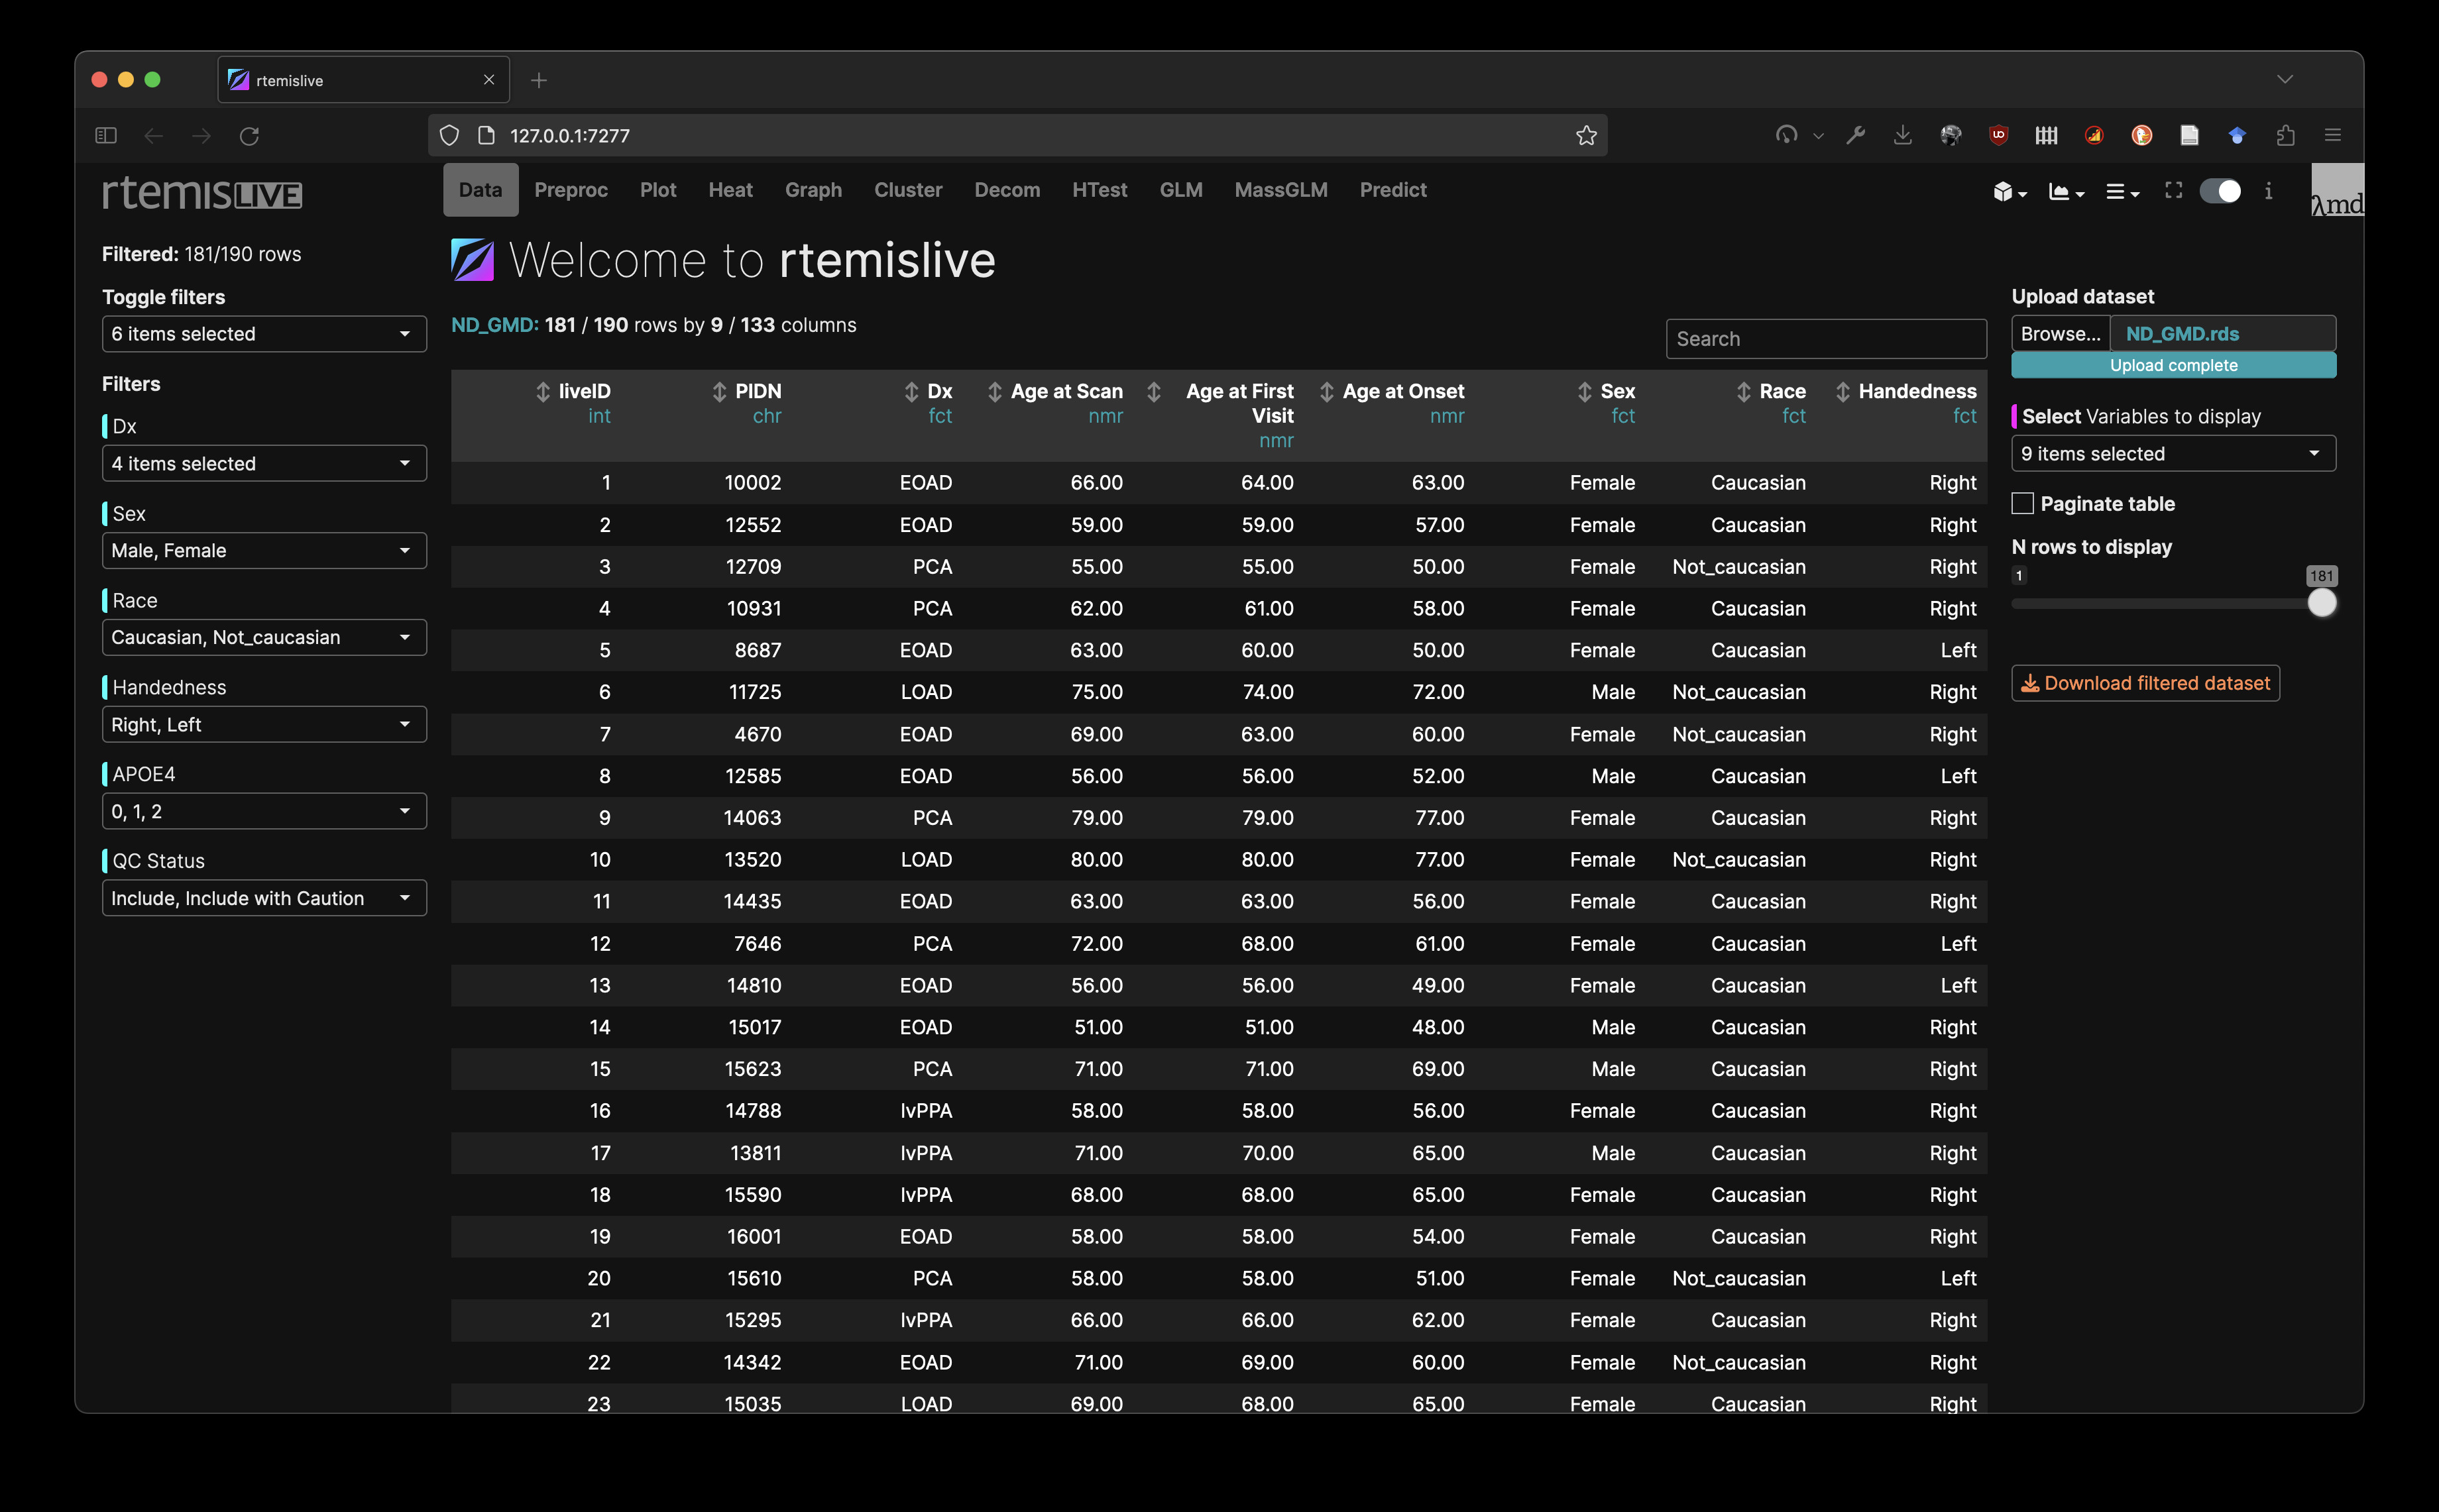
2.2 View loaded data
By default, rtemislive will display the first 10 rows and the first 9 columns of data. This is to avoid slow loading of large datasets.
Use the menu on the right to:
- Select which columns to show
- Choose whether to paginate the table
- Define number of rows to load
The data view allows you to:
- Sort by any column in asceding or descending order
- Search the contents of the table