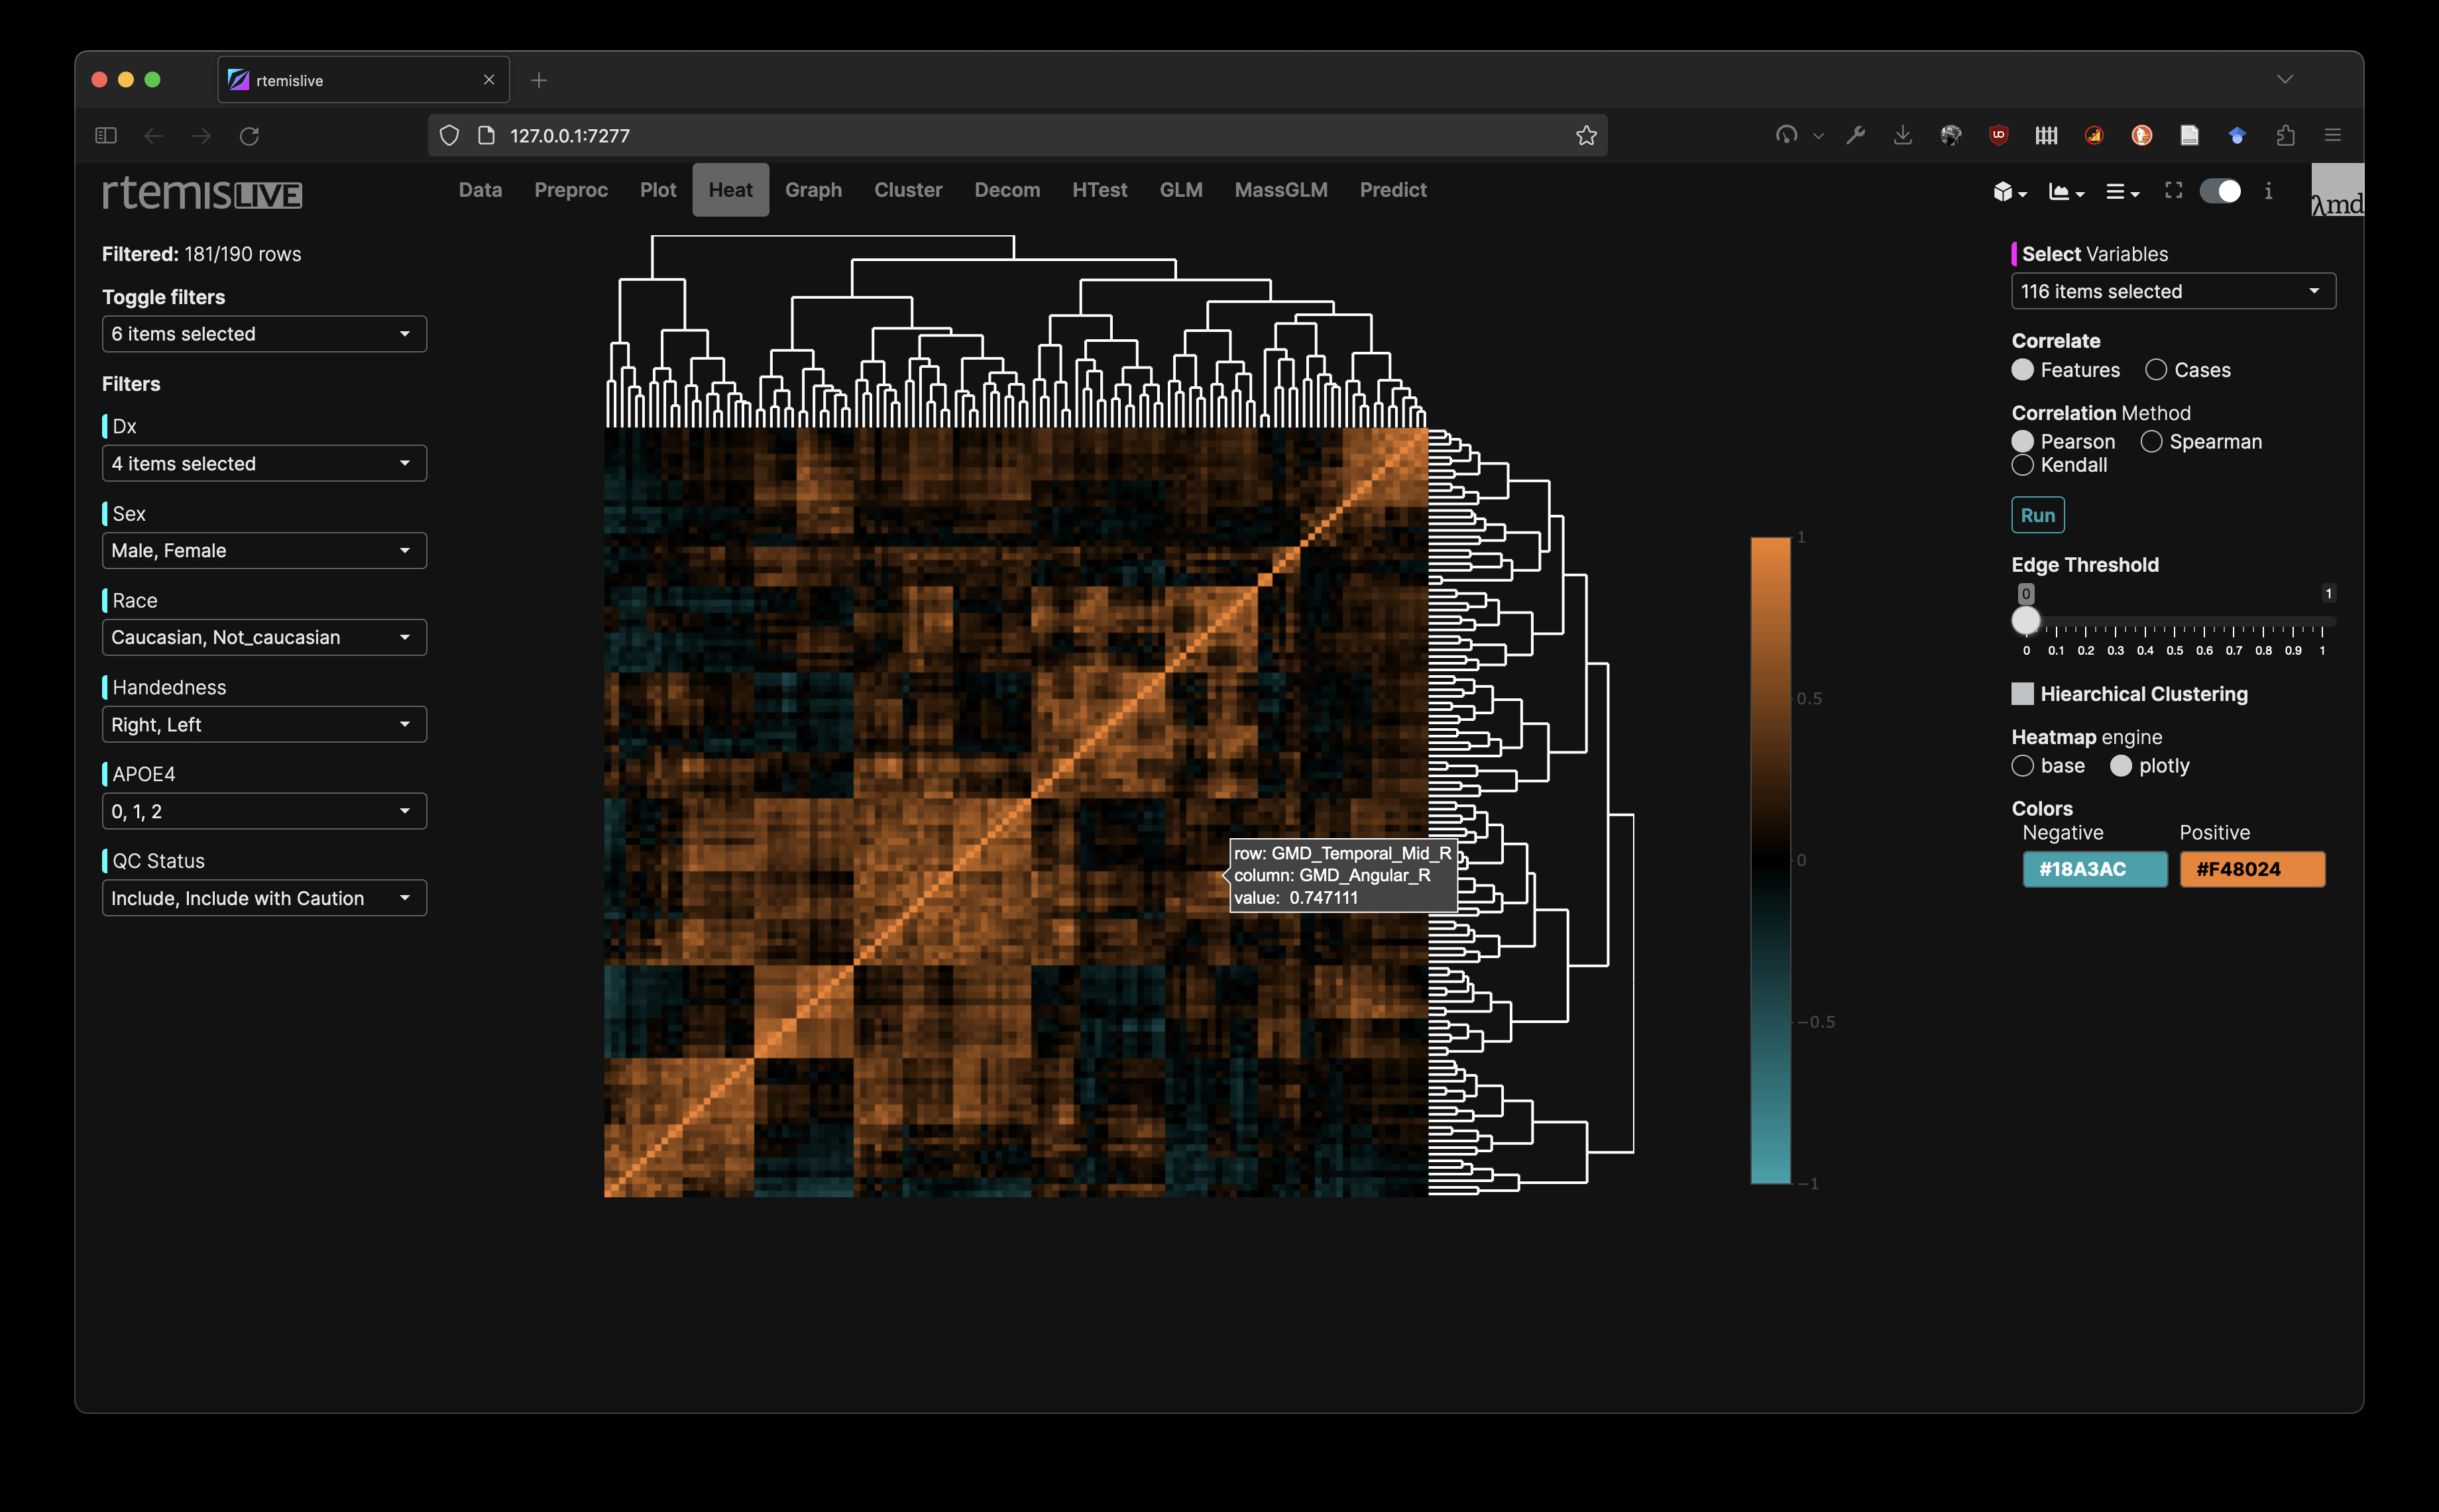
The heatmap module allows plotting heatmaps of the correlation matrix of any number of continuous variables.