10 massGLM
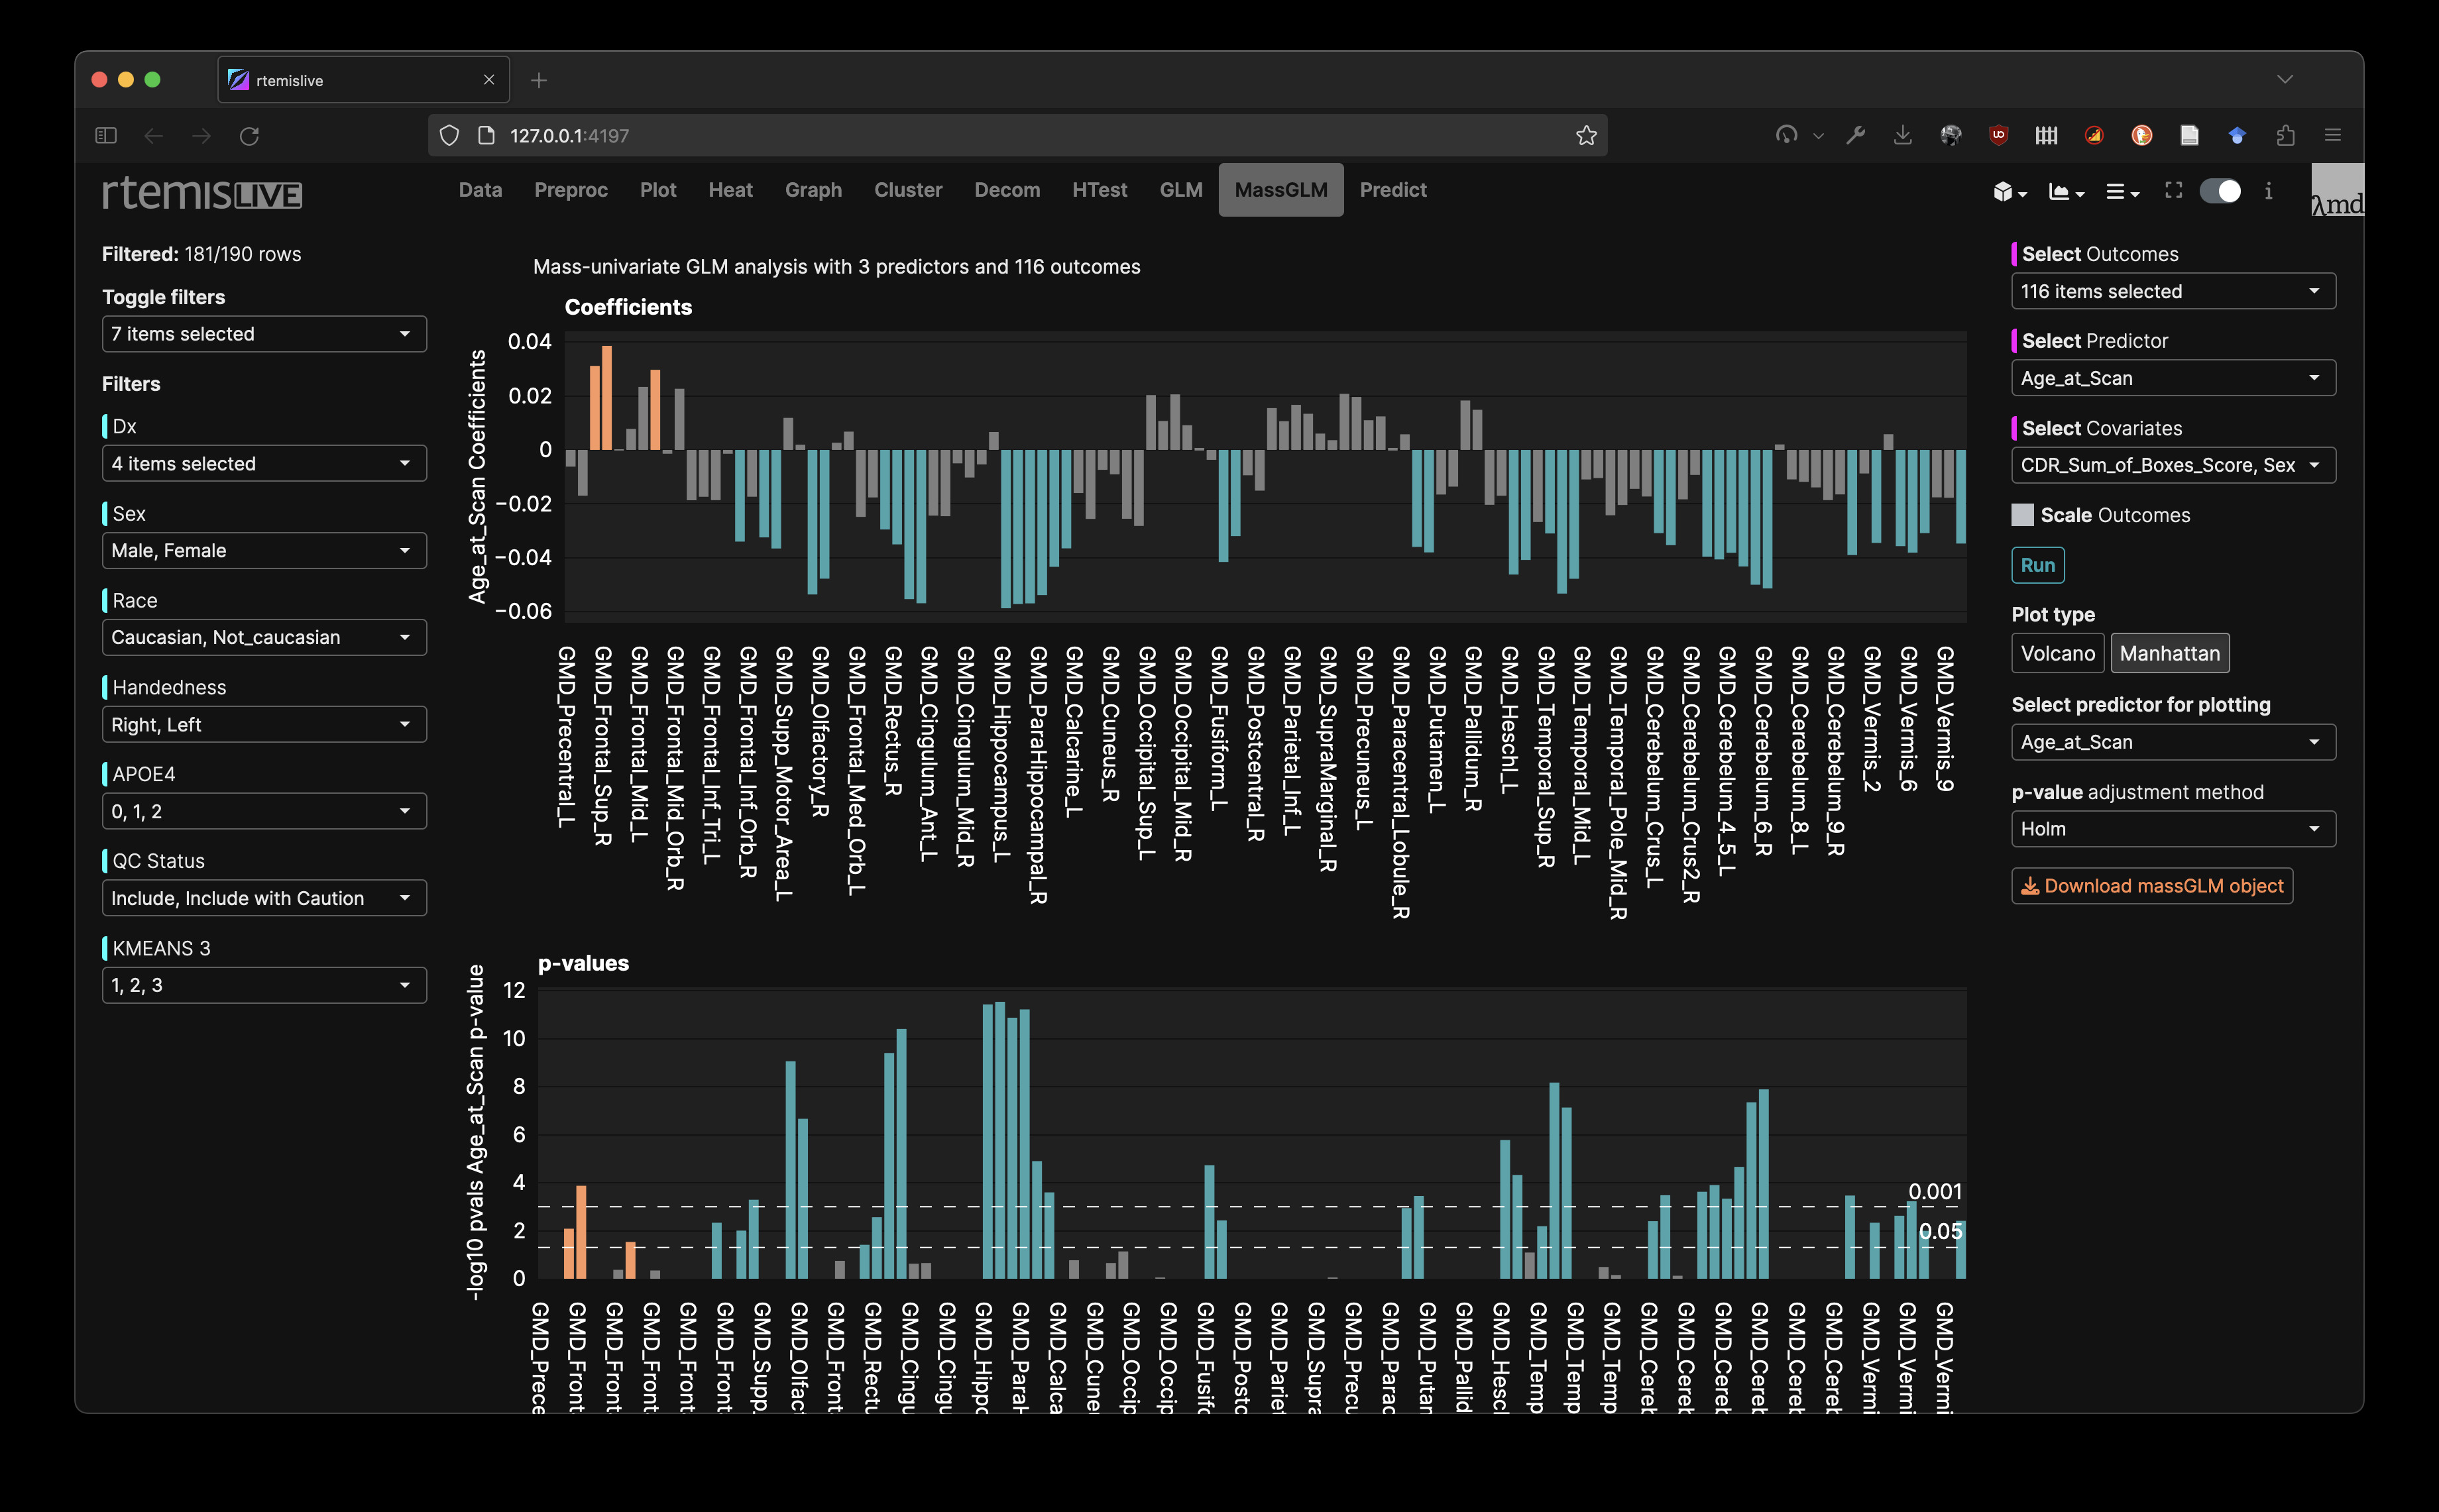
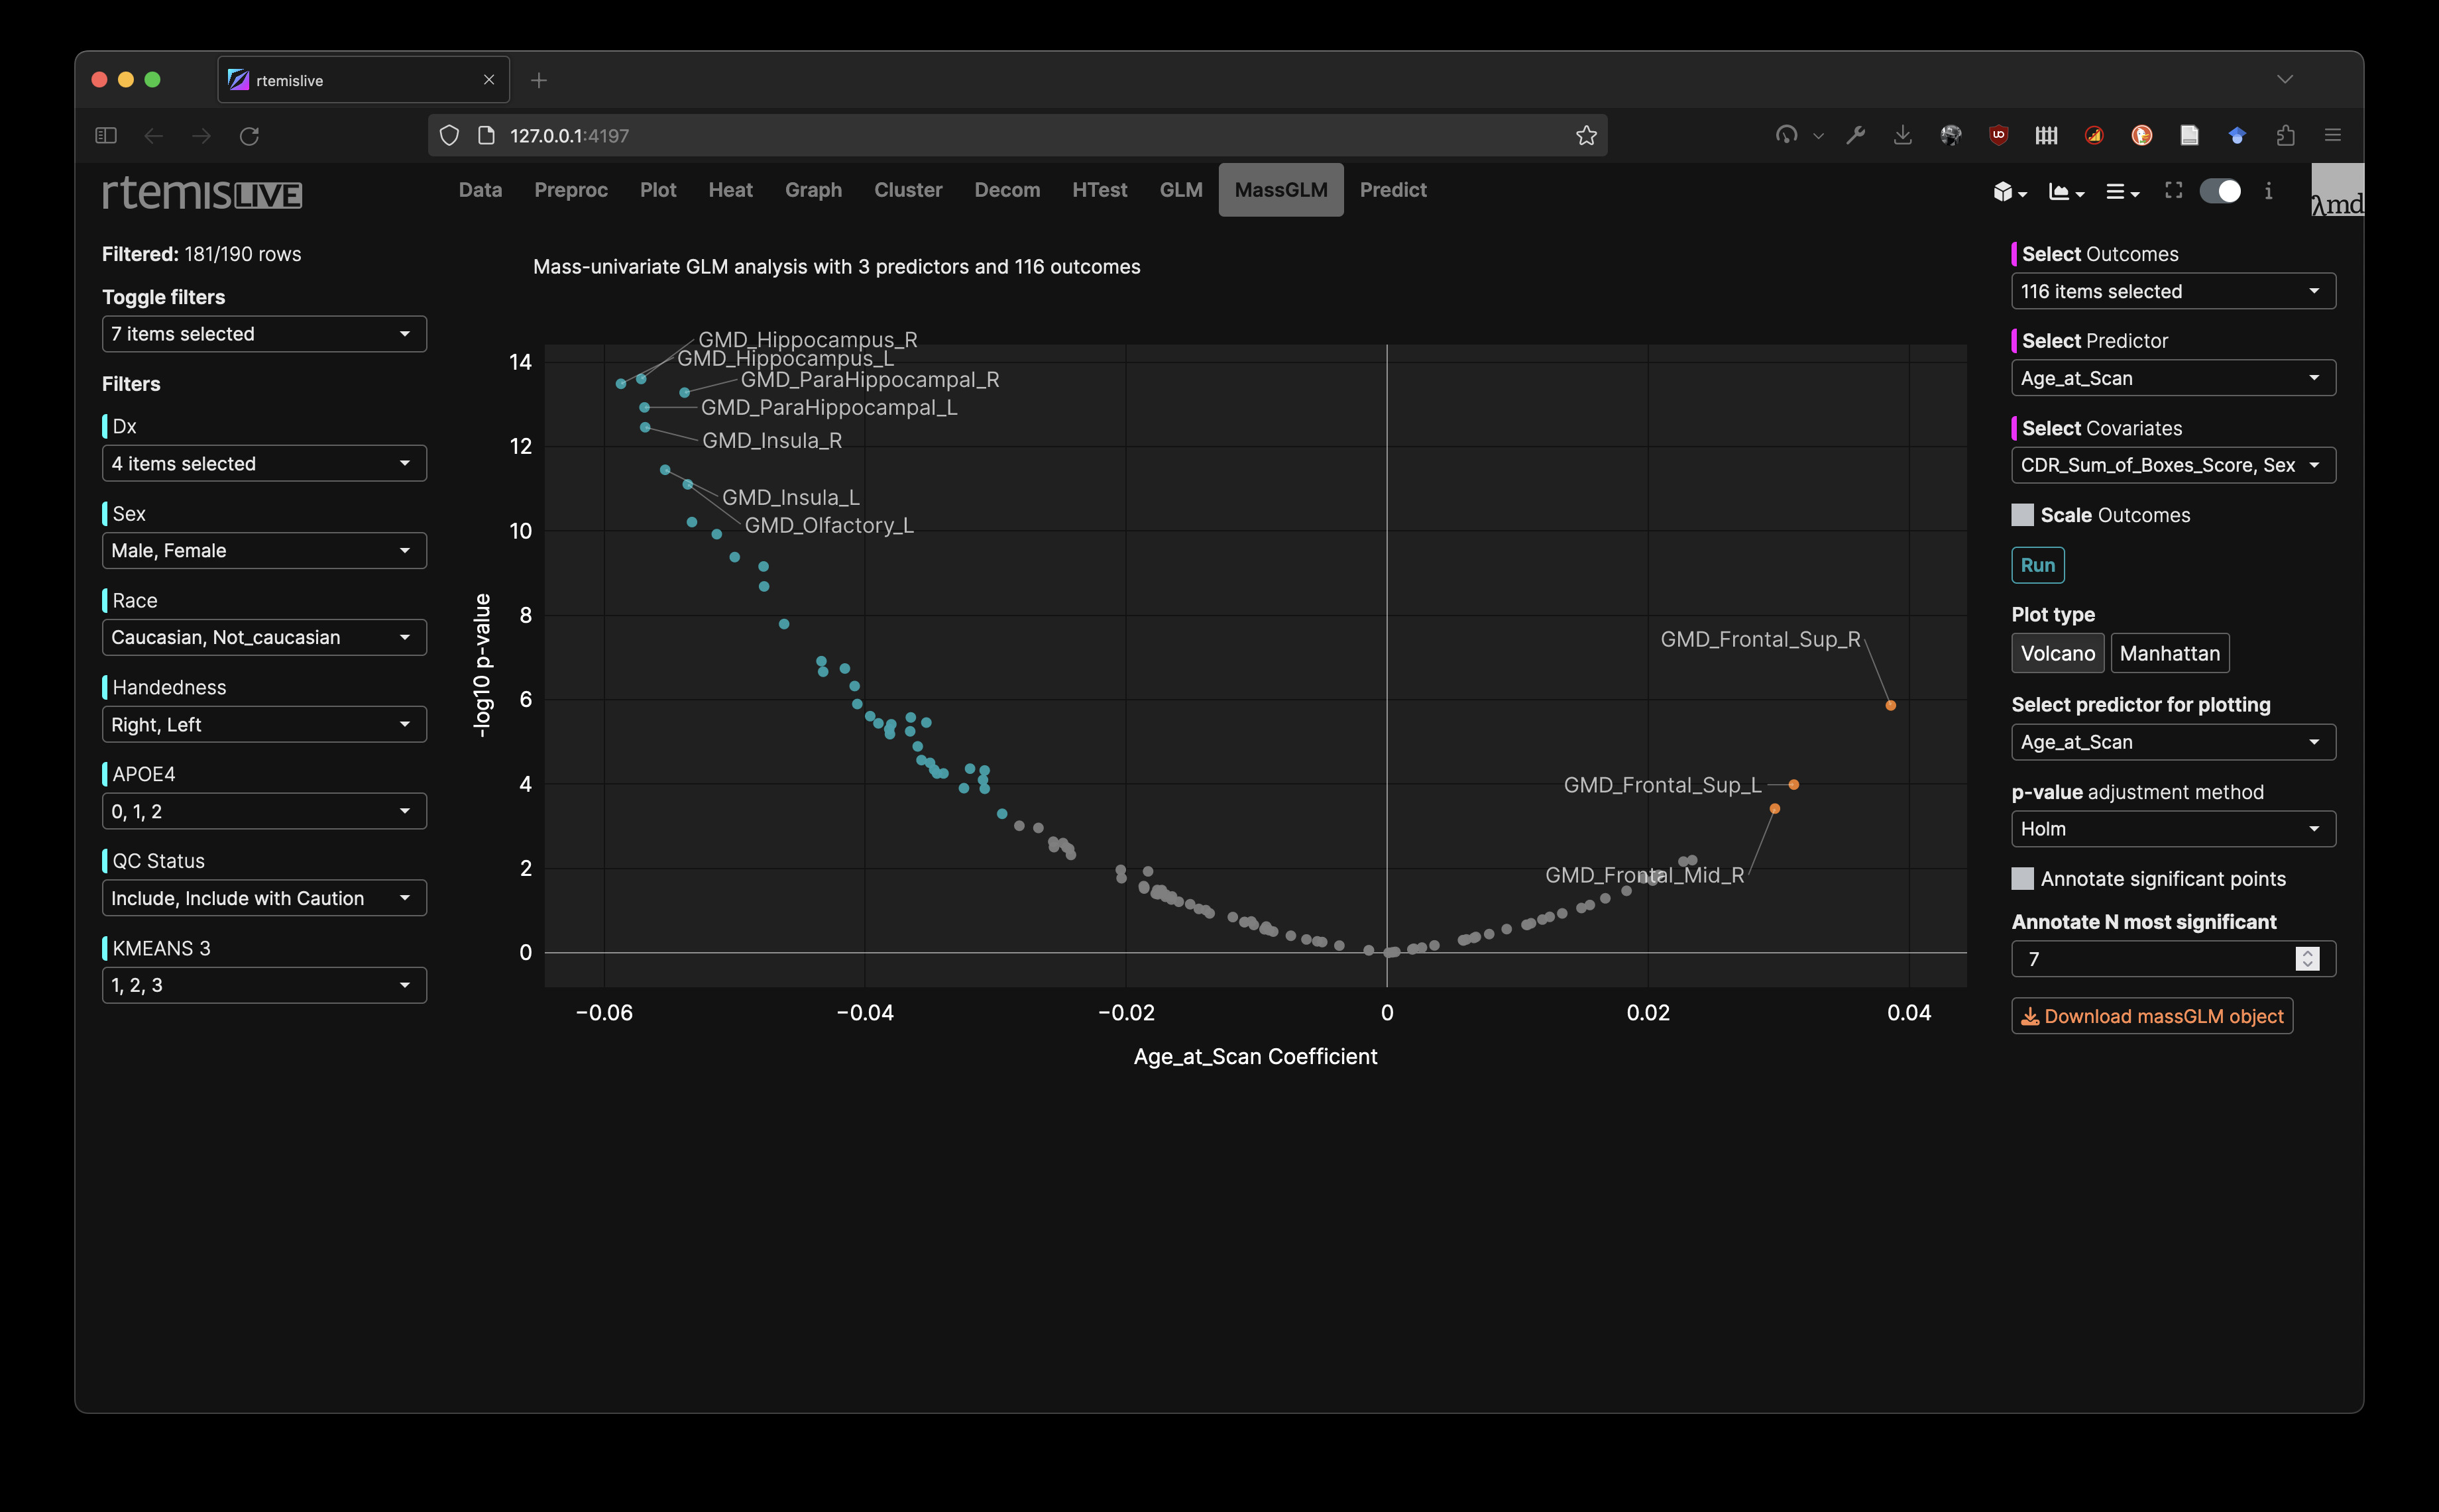
The massGLM module allows you to fit any number of linear models and visualize coefficients and p-values.
Use the right menu to select outcomes, a main predictor of interest, and, optionally, more covariates.
- Outcomes: These should be continuous variables. One linear model will be fit for each. For example, these could measures of individual brain regions (e.g. gray matter volume or density), clinical or neuropsychological scores, etc.
- Predictor: This can be either continuous or categorical. It is the main predictor whose effect you want to test on each of the outcomes. For example, this could be diagnosis, or a continuous measure of performance (e.g. CDR sum-of-boxes)
- Covariates: Optional set of predictors, continuous and categorical. These are sometimes refered to as covariates of no interest, however, their coefficients and p-values can be explored the same way as for the Predictor
massGLM fits models of the following type: \[ y_i \sim Predictor + Covariates \]
for each \(y_i\) in “Outcomes”