library(rtemis)7 Resample
Resampling refers to a collection of techniques for selecting cases from a sample. It is central to many machine learning algorithms and pipelines. The two core uses of resampling are:
- Model selection (a.k.a. tuning) - Find a combination of hyperparameters that works well
- Model assessment - Assessing how well an a performs
By convention, we use the terms training and validation sets when referring to model selection, and training and testing sets when referring to model assessment. The terminology is unfortunately not intuitive and has led to confusion. Some people reverse the terms, but we use the terms training, validation, and testing as they are used in the Elements of Statistical Learning (p. 222, Second edition, 12th printing)
7.1 Model Selection and Assessment
- Model Selection aka Hyperparameter tuning
Resamples of the training set are drawn. For each resample, a combination of hyperparameters is used to train a model. The mean validation-set error across resamples is calculated. The combination of hyperparameters with the minimum loss on average across validation-set resamples is selected to train the full training sample. - Model assessment
Resamples of the full sample is split into multiple training - testing sets. A model is trained on each training set and its performance assessed on the corresponding test set. Model performance is averaged across all test sets.
Nested resampling or nested crossvalidation is the procedure where 1. and 2. are nested so that hyperparameter tuning (resampling of the training set) is performed within each of multiple training resamples and performance is tested in each corresponding test set. [train] performs automatic nested resampling and is one of the core supervised learning functions in rtemis.
7.2 The resample function
The resample() function is responsible for all resampling in rtemis.
x <- rnorm(500)
res <- resample(x).:Resampling Parameters
n.resamples: 10
resampler: strat.sub
stratify.var: y
train.p: 0.75
strat.n.bins: 4
11-19-24 07:58:06 Created 10 stratified subsamples :resample
class(res)[1] "resample" "list" It outputs a list which is an S3 object of class resample, with print and plot methods.
res.:rtemis resample object
N: 10
resampler: strat.sub
train.p: 0.75
strat.n.bins: 4
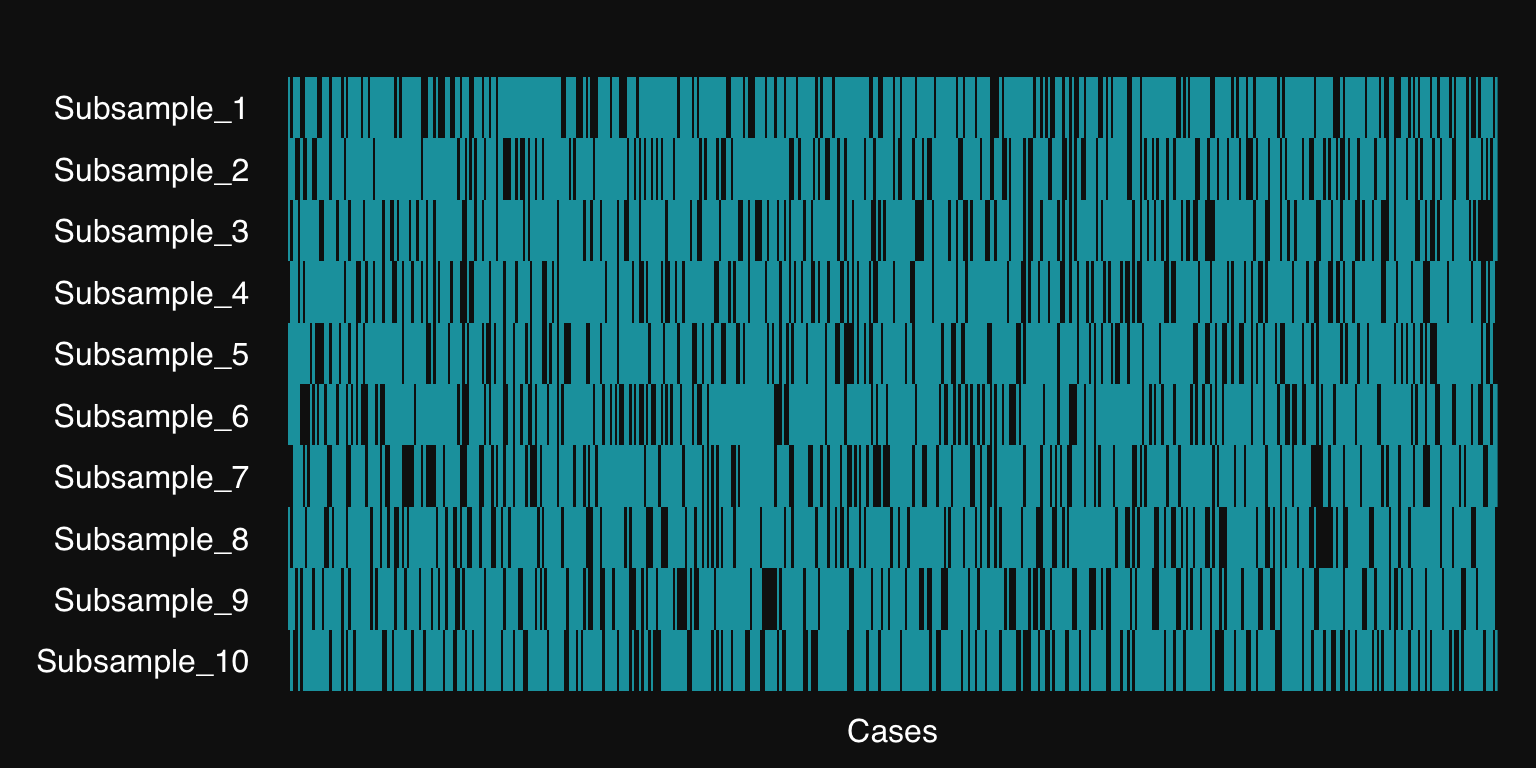
plot(res)
The teal-colored lines represent the training cases selected for each resample, the white are testing cases (held out).
resample() supports 5 types of resampling:
- k-fold crossvalidation (Stratified)
You split the cases into k sets (folds). Each set is used once as the validation or testing set. This means each cases is left out exactly once and there is no overlap between different validation/test sets. In rtemis, the folds are also stratified by default on the outcome unless otherwise chosen. Stratification tries to maintain the full sample’s distribution in both training and left-out sets. This is crucial for non-normally distributed continuous outcomes or imbalanced datasets. 10 is a common value for k, called 10-fold. Note that the size of the training and left-out sets depends on the sample size.
res.10fold <- resample(x, 10, "kfold").:Resampling Parameters
n.resamples: 10
resampler: kfold
stratify.var: y
strat.n.bins: 4
11-19-24 07:58:06 Created 10 independent folds :resample
- Stratified subsampling
Drawn.resamplesstratified samples from the data given a certain probability (train.p) that each case belongs to the training set. Since you are randomly sampling from the full sample each time, there will be overlap in the test set cases, but you control the training-to-testing ratio and number of resamples independently, unlike in k-fold resampling.
res.25ss <- resample(x, 25, "strat.sub").:Resampling Parameters
n.resamples: 25
resampler: strat.sub
stratify.var: y
train.p: 0.75
strat.n.bins: 4
11-19-24 07:58:06 Created 25 stratified subsamples :resample
- Bootstrap
The bootstrap: random sampling with replacement. Since cases are replicated, you should use bootstrap as the outer resampler if you will also have inner resampling for tuning, since the same case may end up in both training and validation sets.
res.100boot <- resample(x, 100, "bootstrap").:Resampling Parameters
n.resamples: 100
resampler: bootstrap
11-19-24 07:58:06 Created 100 bootstrap resamples :resample
- Stratified Bootstrap
This is stratified subsampling with random replication of cases to match the length of the original sample. Same as the bootstrap, do not use if you will be further resampling each resample.
res.100sboot <- resample(x, 100, "strat.boot").:Resampling Parameters
n.resamples: 100
resampler: strat.boot
stratify.var: y
train.p: 0.75
strat.n.bins: 4
target.length: 500
11-19-24 07:58:07 Created 100 stratified bootstraps :resample
- Leave-One-Out-Crossvalidation (LOOCV)
This is k-fold crossvalidation where \(k = N\), where \(N\) is number of data points/cases in the whole sample. It has been included for experimentation and completenes, but it is not recommended either for model selection or assessment over the other resampling methods.
res.loocv <- resample(x, resampler = "loocv").:Resampling Parameters
n.resamples: 500
resampler: loocv
11-19-24 07:58:07 Created 500 independent folds (LOOCV) :resample
7.3 Example: Stratified vs. random sampling in a binomial distribution
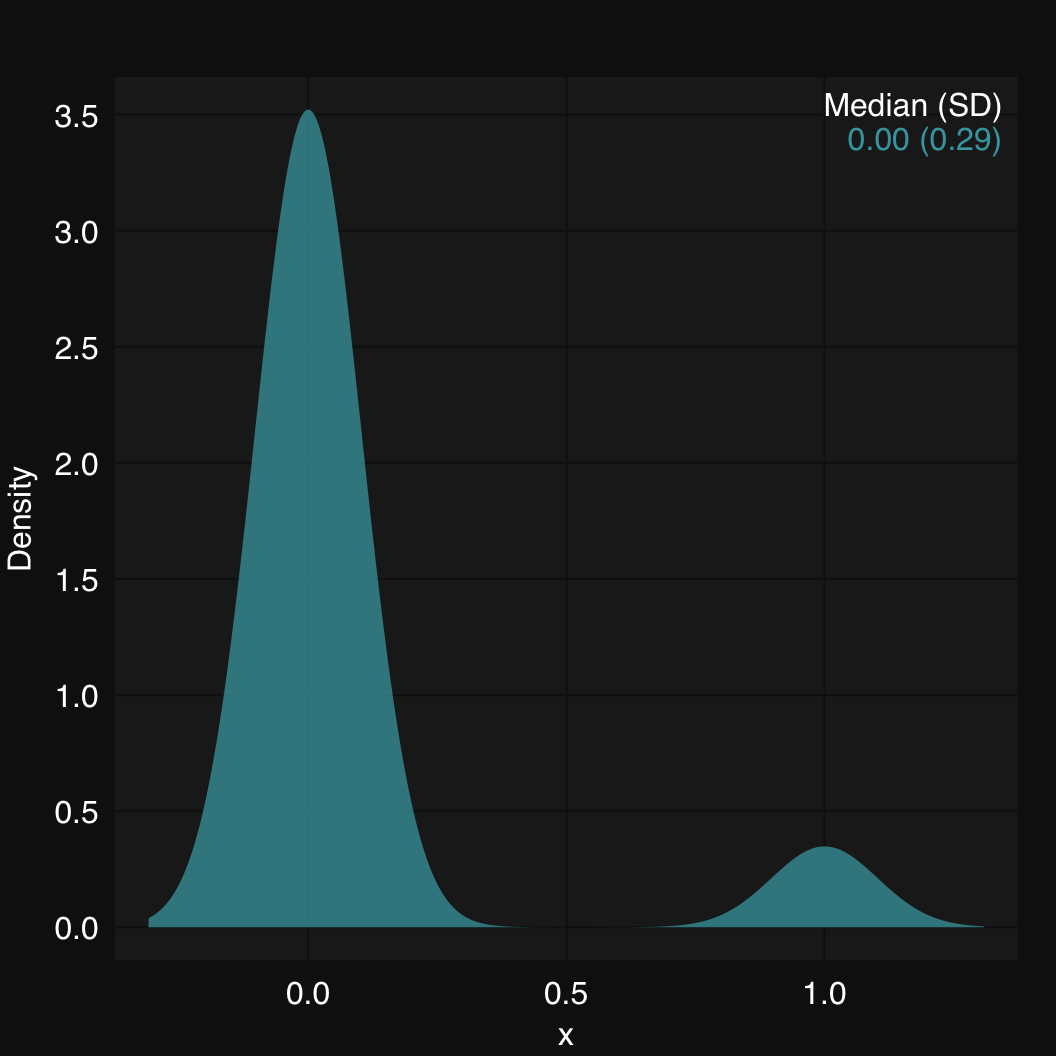
Imagine y is the outcome of interest where events occur with a probability of .1 - a common scenario in many fields.
set.seed(2020)
x <- rbinom(100, 1, .1)
mplot3_x(x)
freq <- table(x)
prob <- freq[2] / sum(freq)
res.nonstrat <- lapply(seq(10), function(i) sample(seq(x), .75*length(x)))
res.strat <- resample(x).:Resampling Parameters
n.resamples: 10
resampler: strat.sub
stratify.var: y
train.p: 0.75
strat.n.bins: 4
11-19-24 07:58:07 Using max n bins possible = 2 :strat.sub
11-19-24 07:58:07 Created 10 stratified subsamples :resample
prob.nonstrat <- sapply(seq(10), function(i) {
  freq <- table(x[res.nonstrat[[i]]])
  freq[2]/sum(freq)
})
prob.strat <- sapply(seq(10), function(i) {
  freq <- table(x[res.strat[[i]]])
  freq[2]/sum(freq)
})
prob.nonstrat
1 1 1 1 1 1 1
0.09333333 0.08000000 0.08000000 0.06666667 0.06666667 0.10666667 0.10666667
1 1 1
0.10666667 0.09333333 0.08000000 sd(prob.nonstrat)[1] 0.0156505prob.strat 1 1 1 1 1 1 1
0.08108108 0.08108108 0.08108108 0.08108108 0.08108108 0.08108108 0.08108108
1 1 1
0.08108108 0.08108108 0.08108108 sd(prob.strat)[1] 0As expected, the random sampling resulted in different event probability in each resample, whereas stratified subsampling maintained a constant probability across resamples.
