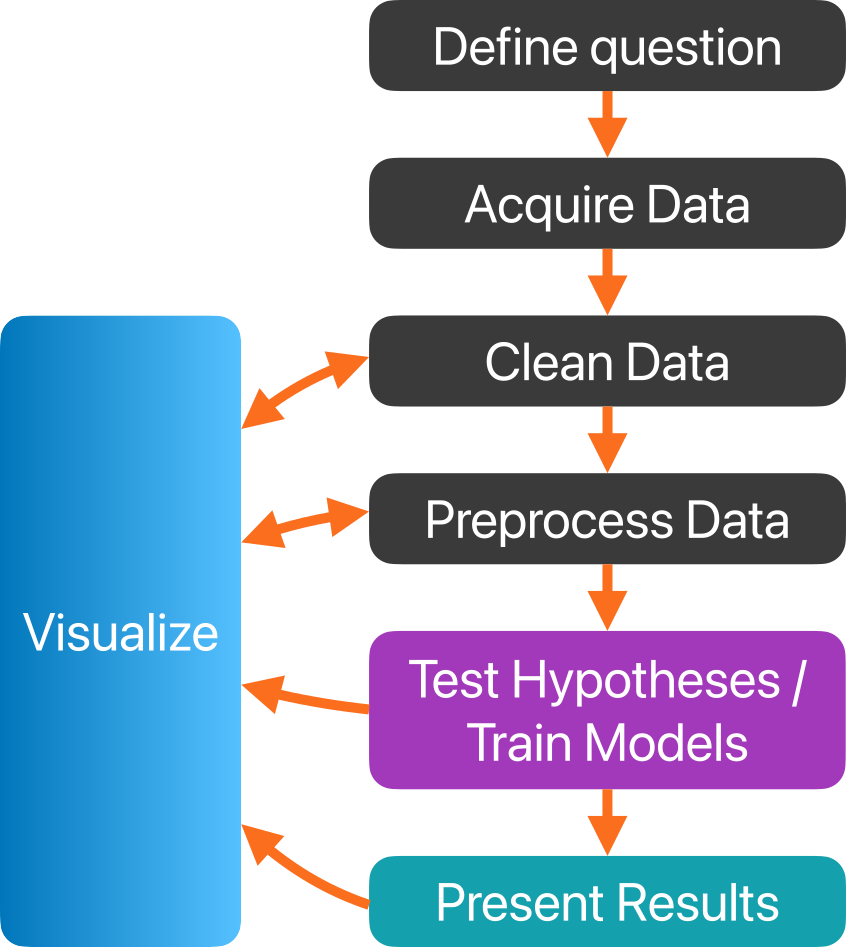
58 Data Pipeline Overview

58.1 Get access to Data
Health-related data comes from many sources, including:
- Electronic Health Records (EPIC)
- Lab/Clinical research data
- Public datasets, e.g. NIH, UK Biobank, etc.
58.2 Handle and inspect data in the command line
Particularly useful for data sets of unknown structure (e.g. to find what delimiter is used) and very large data (will it fit into memory?)
58.3 Read Data into R
- Using R’s
read.csv(),read.table() - Using data.table’s
fread() - Using readr’s
read_csv() - Using specialized packages for third-party data formats
58.4 Clean data names & values
- Using string operations
- Using
factor()to define factor levels
58.5 Define Data Types
- Using the ‘colClasses’ argument in
read.csv(), orfread()
or
- Coercing data types using
as.numeric(),as.character(),factor(),as.Date(),as.POSIXct(), etc.
58.6 Reshape
Convert long to wide or vice versa, as needed.
- Using base
reshape() - Using data.table’s
dcast()andmelt() - Using tidyr’s
pivot_wider()andpivot_longer()
58.7 Join data sets
If you have data in multiple files that need to be merged, you can easily joining them:
- Using
merge()for data.frames or data.tables
58.8 Transform data
Data transformations will depend on the analysis or analyses you wish to perform. Note that we often need to perform different data transformation for different statistical tests or machine learning models (supervised, or unsupervised learning).
58.9 Visualize
Visualization is essential before, during, and data preparation, hypothesis testing, supervised, and unsupervised learning
- Using base graphics:
boxplot(),hist(),plot(),barplot(), etc. - Using ggplot2
- Using plotly interactive plots
58.10 Summarize & Aggregate
58.11 Statistical Hypothesis Testing
t.test(),wilcox.test(),aov(),kruskal.test()- Generalized Linear Models:
glm()
58.12 Predictive Modeling
Perform classification, regression, survival analysis
58.13 Decomposition
Do dimensionality reduction / matrix factorization:
58.14 Clustering
Group cases based on similarity across multiple features:
58.15 Saving data to disk
Save your cleaned dataset to disk:
- base
write.csv() - data.table’s
fwrite() - base
saveRDS()
58.16 Program your own functions!
For all the above operations, you will often be better off writing your own customized functions using the above base and third-party packages for your specific data needs and analysis goals.
58.17 Always document your code!
Always remember to add in-line comments (#) to your functions, scripts, Quarto documents for your future self, your collaborators, and the world.
